- Home
- Blog Standard
- Audit
- Benchmarking Capacity: How Do You Compare to High-Performing CPA Firms?

Benchmarking Capacity: How Do You Compare to High-Performing CPA Firms?
In today’s accounting and CPA firm landscape, working hard isn’t enough. You must work smart, scale capacity, and keep audit and service quality airtight.
The real question is: How does your CPA firm’s capacity compare to the best in the business?
Benchmarking capacity is the process of measuring your firm’s ability to deliver consistently high-quality work without burning out staff, missing deadlines, or over-promising to clients. Done well, it reveals exactly where you’re winning, where you’re lagging, and the exact steps you need to close the gap.
1. Why Capacity Benchmarking Matters for Accounting Firms in 2025
The accounting profession has entered a pressure-cooker phase. Clients demand more advisory services, regulatory scrutiny is intense, and staffing shortages mean every hour counts.

According to the AICPA MAP Survey:
- Net client fees per partner up 15% in 2023
- Staff turnover still hovering above 12% for many firms
- Top firms consistently generate $1.25M per partner, compared to the median $556K
Translation: The leaders aren’t necessarily bigger – they’re better at aligning capacity, process efficiency, and quality control.
2. Key CPA Firm Capacity Benchmarks: Lessons From the Data
Pulling from AICPA, Inside Public Accounting (IPA), PCAOB inspections, and global audit data, here’s what the capacity gap looks like:
| Metric | Top Performers | Median Firms | Gap You Can Close |
| Net client fees per partner | $1.25M | $556K | +$694K |
| Revenue per employee | $209K | $155K | +$54K |
| Personnel costs (% revenue) | 46% | 50%+ | 3–5 pts |
| Staff turnover | 9% | 12–15% | 2–5 pts |
3. CPA Firm Capacity Scorecard
Below is a visual snapshot comparing the median CPA firm to top-performing firms.
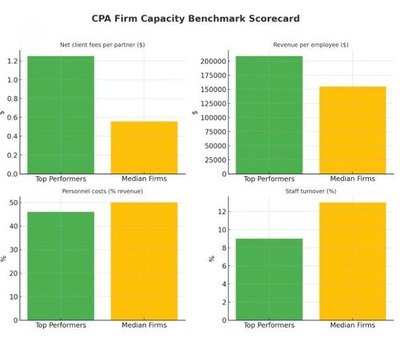
Based on the CPA Firm Capacity Benchmark Scorecard, top-performing firms generally outperform median firms across key metrics.
Key Insights from the Scorecard
The scorecard presents four key performance indicators:
- Net client fees per partner: Top performers generate significantly more in net client fees per partner. The green bar for top performers is over twice the height of the orange bar for median firms, suggesting greater efficiency and/or a more profitable client base.
- Revenue per employee: Top performers have a higher revenue per employee, indicating that they are more effective at generating income from their workforce. The green bar for top performers is noticeably taller than the orange bar for median firms, suggesting a more productive staff or higher-value services.
- Personnel costs as a percentage of revenue: Top performers have lower personnel costs as a percentage of their total revenue. This means they are more efficient at managing their largest expense- staff salaries and benefits—relative to the income they bring in.
- Staff turnover: Top performers experience a lower staff turnover rate. The orange bar for median firms is significantly taller, suggesting they struggle more with retaining talent. Lower turnover for top performers likely contributes to their higher productivity and stronger firm culture.
In summary, the scorecard highlights a clear competitive advantage for top-performing CPA firms, which are more efficient, profitable, and better at retaining talent than their median counterparts. These firms likely have better operational strategies and a stronger focus on employee engagement and client value.
4. The Capacity Maturity Model for Accounting Firms
The Capacity Maturity Model helps firms identify where they stand in terms of resource management and performance tracking:
| Stage | Characteristics |
| Reactive | No real KPI tracking, firefighting mode |
| Aware | KPIs tracked, but not used for decisions |
| Managed | KPIs drive staffing, pricing, and client selection |
| Optimised | Continuous improvement, predictive resourcing, zero surprises |
Top-performing CPA firms typically operate in the Managed and Optimised stages – not by chance, but through disciplined processes and proactive decision-making.
5. What High-Performing CPA Firms Do Differently
From survey data and case studies, the best-performing firms:
- Standardise processes – onboarding, audit file assembly, review steps
- Forecast capacity – match staff to peak workloads months in advance
- Select clients strategically – removing unprofitable engagements
- Automate routine work – freeing staff for higher-value, billable tasks
- Integrate quality control into workflows instead of treating it as a final step
6. Benchmark-to-Action Map: Closing Capacity Gaps
| Metric Gap | Why It Matters | First Step to Close the Gap |
| Low revenue per employee | Signals under-utilisation of staff capacity | Analyse billable vs non-billable hours |
| High personnel costs | Erodes profitability | Review client mix & pricing |
| High turnover | Drives recruitment & training costs | Conduct stay interviews & clarify career paths |
Low revenue per employee usually means your team’s capacity isn’t fully monetised. This can result from too much time spent on non-billable tasks, inefficient workflows, or staff operating below their skill level. The impact is direct – profitability suffers. Start by analysing billable vs non-billable hours, streamline processes, and reassign work to better-matched resources.
High personnel costs and turnover both drain profitability and operational stability. Overspending on labour often comes from an unbalanced client mix or underpriced services, while frequent departures increase recruitment costs and disrupt delivery. Review your client base and pricing model, and invest in retention with stay interviews, clear career paths, and balanced workloads.

Bottom Line
Benchmarking your CPA firm’s capacity isn’t about vanity metrics – it’s about visibility. The top-performing accounting firms don’t get ahead by working longer hours; they measure what matters, fix inefficiencies, and scale what works including outsourcing audit support.
With the right KPI tracking, benchmarking tools, and maturity model, your firm can join their ranks – not by growing bigger, but by operating smarter.


